Retail sales totalled 12,256 cars in Q4 2024, up 5.3% versus Q4 2023, driven by a growing model line-up
- Order intake in Q4 2024 up 37.2% versus Q4 2023, creating strong momentum as we enter 2025
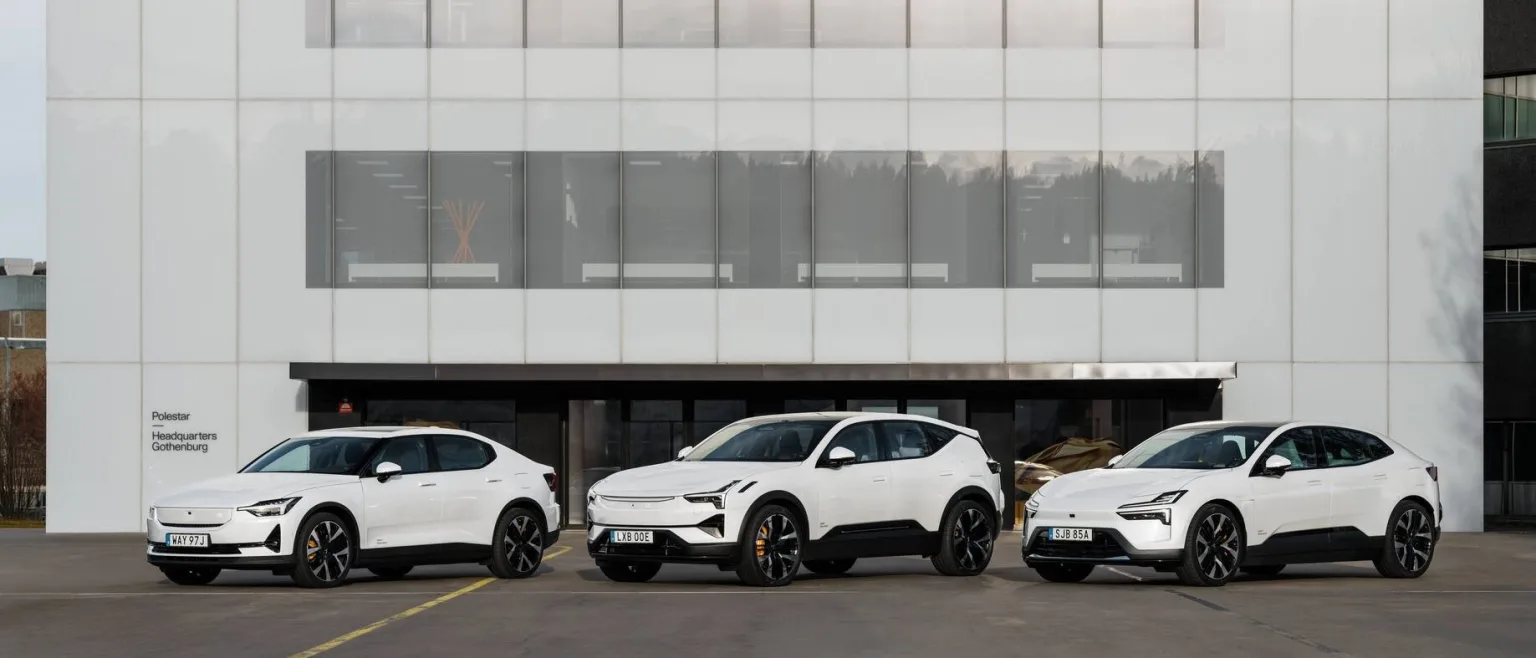
- Polestar 3 and Polestar 4 represent 56% of order intake in Q4 2024
Polestar retail sales totalled 12,256 cars in Q4 2024, up 5.3% versus Q4 2023, taking total retail sales for the full year to 44,851 in 2024, down 15% versus 2023. Total order intake in Q4 2024 increased by 37.2% versus Q4 2023 and by 37.9% for the full year 2024 versus 2023.
Michael Lohscheller, Polestar CEO, says: “The changes being made to our commercial operations are clearly having a positive impact, as we saw a 5.3% increase in retail sales and a 37.2% increase in order intake compared to the same quarter last year, creating a strong momentum as we enter 2025.”
Breakdown of retail sales compared to previous period:
| Q4 2024 | Q4 2023 | Change (%) | |
| Retail sales | 12,256 | 11,640 | 5.3% |
| FY 2024 | FY 2023 | Change (%) | |
| Retail sales | 44,851 | 52,796 | -15% |
To align more closely with sector convention, Polestar has amended its definition of global volumes, with the new definition being retail sales representing sales to end customers
The following table illustrates historical differences versus the prior definition:
| Restatement for new definition (Retail sales) (1) | Published as per previous definition (2)(3) | |
| Q3 2022 | 8,393 | 9,239 |
| Q4 2022 | 20,243 | 21,067 |
| FY 2022 | 50,510 | 51,491 |
| Q1 2023 | 12,006 | 12,076 |
| Q2 2023 | 15,485 | 15,792 |
| Q3 2023 | 13,666 | 13,976 |
| Q4 2023 | 11,641 | 12,782 |
| FY 2023 | 52,798 | 54,626 |
| Q1 2024 | 6,975 | 7,217 |
| Q2 2024 | 13,072 | 13,026 |
| Q3 2024 | 12,548 | 11,938 |
| Q4 2024 | 12,256 | 12,277 |
| FY 2024 | 44,851 | 44,458 |
1. Retail Sales figures, which the Company publishes quarterly from now on, are sales to end customers. Retail Sales include new cars handed over via all sales channels and all sale types, including but not restricted to internal, fleet, retail, rental and leaseholders’ channels across all markets irrespective of their market model and setup and may or may not generate direct revenue for Polestar. These handover figures are comparable to the retail sales figures reported by our competitors.
2. Represents the sum of total volume of vehicles delivered for (a) external sales of new vehicles without repurchase obligations, (b) external sales of vehicles with repurchase obligations, and (c) internal use vehicles for demonstration and commercial purposes or to be used by Polestar employees (vehicles are owned by Polestar and included in inventory). A vehicle is deemed delivered and included in the volume figure for each category once invoiced and registered to the external or internal counterparty, irrespective of revenue recognition. Revenue is recognized in scenarios (a) and (b) in accordance with IFRS 15, Revenue from Contracts with Customers (“IFRS 15”), and IFRS 16, Leases (“IFRS 16”), respectively. Revenue is not recognized in scenario (c).
3. The figures in this column reflect actual sales volumes calculated using the former global volumes definition described in Note 2 above and may, for certain periods, differ slightly to previously reported figures due to rounding.


