“After nine months, Volkswagen Group deliveries are around three percent down on the same period last year in a market environment that remains challenging. We grew significantly in North and South America and increased our market share. In Europe, we were able to keep our vehicle handovers to customers largely stable, but are experiencing significant headwinds from the market. The competitive situation in China is particularly intense, which is the main reason for the global decline in our deliveries. In the coming months, numerous attractive new models across all brands will strengthen our market position worldwide. In addition, however, a better cost base, particularly in Germany, is essential to remain successful in this environment in the future.”
Marco Schubert, Member of the Group’s Extended Executive Committee for Sales
Key figures
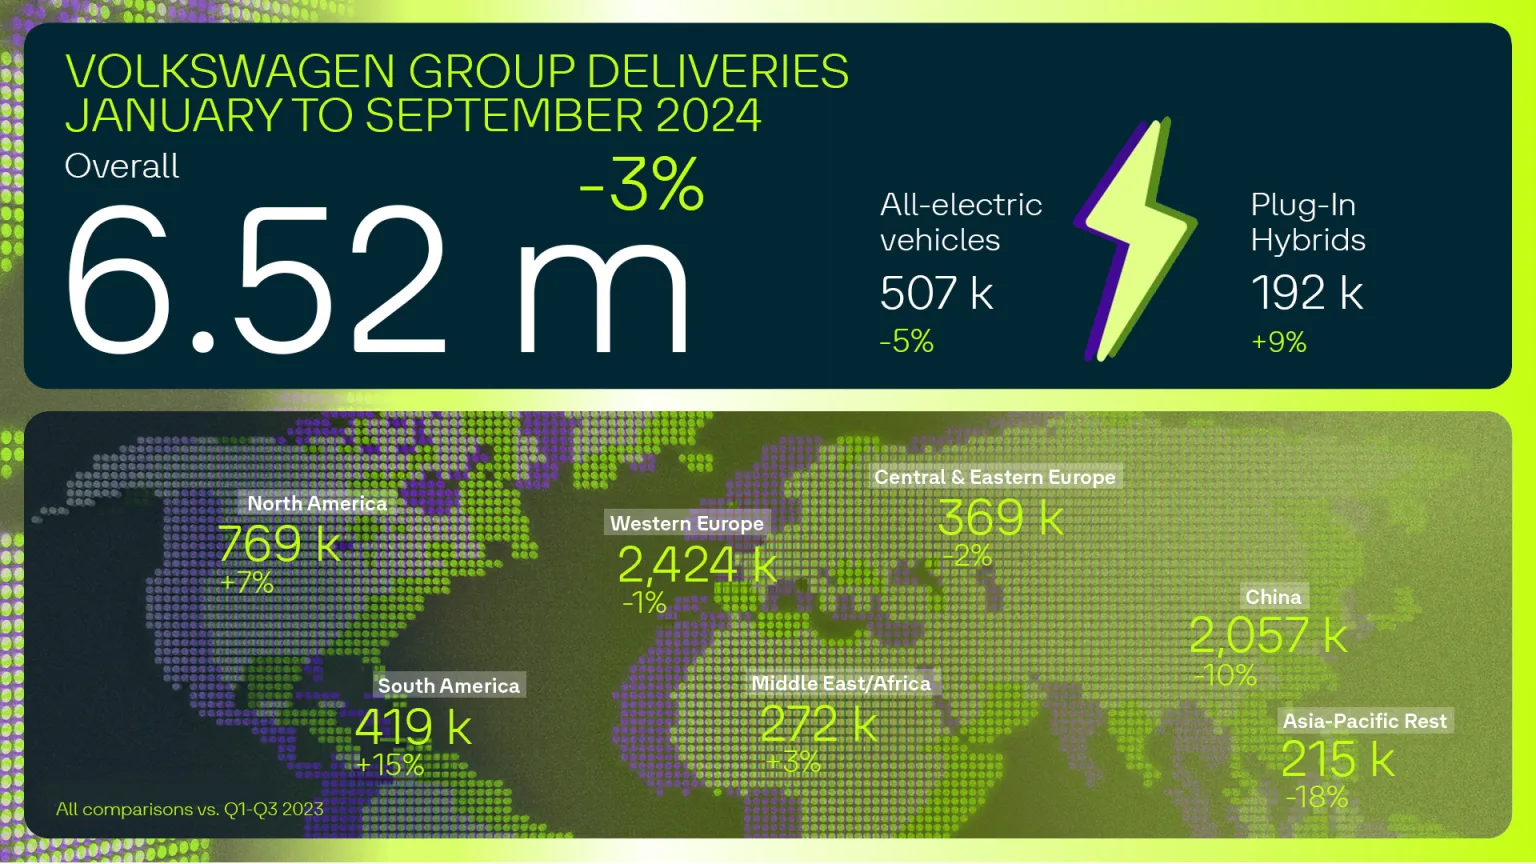
6.52 million vehicles delivered worldwide after 3 quarters, down 2.8 percent on the previous year (6.72 million vehicles)
Growth in North America (+7%) and South America (+15%) was offset by declines in Western Europe (-1%) and particularly in China (-10%).
506,500 vehicles worldwide BEV deliveries after 3 quarters down 4.7 percent on the previous year (531,500 vehicles)
BEV share of around 8 percent at the end of September is at the previous year’s level, significantly more BEVs delivered in China (+27 percent), declining development in the USA (-26 percent).
Volkswagen Group remains BEV market leader in Europe despite lower deliveries (market share around 19 percent).
BEV order intake in Western Europe doubled by the end of September
BEV order bank in Western Europe stands at around 170,000 vehicles, deliveries of new models such as the VW ID.7 Tourer, Audi Q6 e-tron and Porsche Macan Electric will provide a further tailwind in Q4.
192,000 vehicles worldwide PHEV deliveries are around 9 percent higher than in the same period last year
Demand for vehicles with modern second-generation plug-in hybrid drives (PHEV) and purely electric ranges of up to 143 km is increasing.
Development of core regions
Europe
The region as a whole declined by 0.9 percent to 2.79 million vehicles. Western Europe fell by 0.7 percent, while Central and Eastern Europe lost 1.7 percent. In the home market of Germany, the decline amounted to 1.6 percent.
North America
769,000 vehicles delivered represent a significant increase of 7.4 percent. The Volkswagen Group grew by 1.5 percent in the main market USA.
South America
At 14.6 percent, the region recorded the strongest growth to 419,100 vehicles. The largest contribution to this positive development was made by the core market of Brazil with growth of 19.1 percent.
Asia-Pacific
The region recorded a decline of 11.0 percent to 2.27 million vehicles. Main reason was the intense competitive situation in China, as a result of which Volkswagen Group deliveries fell by 10.2 percent.
Best-selling all-electric vehicles (BEV)
- Volkswagen ID.4/ID.5 135,200
- Volkswagen ID.3 105,900
- Audi Q4 e-tron (incl. Sportback) 78,800
- Škoda Enyaq (incl. Coupé) 50,800
- CUPRA Born 29,600
- Audi Q8 e-tron (incl. Sportback) 23,900
- Volkswagen ID.7 (incl. Tourer) 22,200
- Volkswagen ID. Buzz (incl. Cargo) 20,000
Deliveries Volkswagen Group – All drive types
| Deliveries to customers by market | Jul. – Sep. 2024 | Jul. – Sep. 2023 | Delta (%) | Jan. – Sep. 2024 | Jan. – Sep. 2023 | Delta (%) |
| Western Europe | 743,600 | 799,300 | -7.0 | 2,424,400 | 2,442,600 | -0.7 |
| Central and Eastern Europe | 117,000 | 121,500 | -3.7 | 368,600 | 374,900 | -1.7 |
| North America | 273,800 | 257,400 | +6.4 | 769,000 | 716,100 | +7.4 |
| South America | 163,800 | 144,400 | +13.4 | 419,100 | 365,700 | +14.6 |
| China | 711,500 | 837,200 | -15.0 | 2,056,600 | 2,289,100 | -10.2 |
| Asia-Pacific Rest | 70,300 | 91,700 | -23.4 | 214,800 | 262,700 | -18.3 |
| Middle East/Africa | 96,400 | 91,900 | +4.9 | 271,700 | 264,300 | +2.8 |
| World | 2,176,300 | 2,343,300 | -7.1 | 6,524,300 | 6,715,400 | -2.8 |
| Deliveries to customers by brand | Jul. – Sep. 2024 | Jul. – Sep. 2023 | Delta (%) | Jan. – Sep. 2024 | Jan. – Sep. 2023 | Delta (%) |
| Brand Group Core | 1,613,600 | 1,701,700 | -5.2 | 4,801,500 | 4,818,800 | -0.4 |
| Volkswagen Passenger Cars | 1,176,400 | 1,259,500 | -6.6 | 3,396,800 | 3,484,200 | -2.5 |
| Škoda | 222,700 | 210,000 | +6.0 | 671,300 | 642,200 | +4.5 |
| SEAT/CUPRA | 124,700 | 130,400 | -4.4 | 422,100 | 391,800 | +7.7 |
| Volkswagen Commercial Vehicles | 89,800 | 101,800 | -11.8 | 311,300 | 300,500 | +3.6 |
| Brand Group Progressive | 407,400 | 484,900 | -16.0 | 1,251,400 | 1,404,400 | -10.9 |
| Audi | 402,600 | 479,500 | -16.0 | 1,235,600 | 1,386,600 | -10.9 |
| Bentley | 1,900 | 3,000 | -35.6 | 7,400 | 10,100 | -26.6 |
| Lamborghini | 2,900 | 2,400 | +18.7 | 8,400 | 7,700 | +8.6 |
| Brand Group Sport Luxury | 70,100 | 75,400 | -7.0 | 226,000 | 242,700 | -6.9 |
| Porsche | 70,100 | 75,400 | -7.0 | 226,000 | 242,700 | -6.9 |
| Brand Group Trucks / TRATON | 85,300 | 81,400 | +4.8 | 245,400 | 249,500 | -1.6 |
| MAN | 19,800 | 28,000 | -29.4 | 68,900 | 84,000 | -18.0 |
| Volkswagen Truck & Bus | 12,400 | 9,600 | +28.4 | 35,700 | 29,700 | +20.5 |
| Scania | 21,700 | 21,400 | +1.6 | 74,000 | 67,700 | +9.3 |
| International | 31,500 | 22,400 | +40.5 | 66,800 | 68,200 | -2.1 |
| Volkswagen Group (total) | 2,176,300 | 2,343,300 | -7.1 | 6,524,300 | 6,715,400 | -2.8 |
Deliveries Volkswagen Group – All-electric vehicles (BEV)
| Deliveries to customers by market | Jul. – Sep. 2024 | Jul. – Sep. 2023 | Delta (%) | Jan. – Sep. 2024 | Jan. – Sep. 2023 | Delta (%) |
| Europe | 109,200 | 124,000 | -11.9 | 293,300 | 341,100 | -14.0 |
| USA | 11,900 | 20,500 | -41.7 | 37,100 | 50,300 | -26.2 |
| China | 57,500 | 54,700 | +5.2 | 148,100 | 117,100 | +26.5 |
| Rest of the world | 10,700 | 10,800 | -0.7 | 28,100 | 23,100 | +21.4 |
| World | 189,400 | 209,900 | -9.8 | 506,500 | 531,500 | -4.7 |
| Deliveries to customers by brand | Jul. – Sep. 2024 | Jul. – Sep. 2023 | Delta (%) | Jan. – Sep. 2024 | Jan. – Sep. 2023 | Delta (%) |
| Brand Group Core | 142,300 | 152,100 | -6.5 | 373,200 | 379,400 | -1.6 |
| Volkswagen Passenger Cars | 102,700 | 108,200 | -5.1 | 271,200 | 273,000 | -0.7 |
| Škoda | 21,300 | 23,100 | -7.8 | 50,800 | 54,400 | -6.7 |
| SEAT/CUPRA | 12,900 | 13,500 | -4.4 | 31,200 | 32,300 | -3.7 |
| Volkswagen Commercial vehicles | 5,400 | 7,300 | -26.3 | 20,000 | 19,600 | +2.2 |
| Brand Group Progressive | 39,100 | 47,400 | -17.4 | 115,800 | 123,000 | -5.9 |
| Audi | 39,100 | 47,400 | -17.4 | 115,800 | 123,000 | -5.9 |
| Bentley | – | – | – | – | – | – |
| Lamborghini | – | – | – | – | – | – |
| Brand Group Sport Luxury | 7,400 | 9,900 | -25.0 | 16,400 | 27,900 | -41.0 |
| Porsche | 7,400 | 9,900 | -25.0 | 16,400 | 27,900 | -41.0 |
| Brand Group Trucks / TRATON | 500 | 500 | -1.3 | 1,100 | 1,200 | -4.4 |
| MAN | 150 | 280 | -46.7 | 380 | 670 | -43.0 |
| Volkswagen Truck & Bus | 10 | 10 | +180.0 | 100 | 40 | +139.0 |
| Scania | 80 | 40 | +81.8 | 190 | 190 | +0.0 |
| International | 290 | 210 | +37.0 | 460 | 280 | +65.1 |
| Volkswagen Group (total) | 189,400 | 209,900 | -9.8 | 506,500 | 531,500 | -4.7 |


