

On March 11, 2025, the Volkswagen Group will publish the Full Year Results 2024.
“In 2024, Volkswagen Group has set a decisive strategic course. With innovative, emotional products. With trailblazing strategic decisions. In 2025, we will continue to focus on consistent implementation. As our transformation gains in traction, the new strength of Volkswagen Group comes to life. Our continuing model offensive, regionally tailored products for our markets around the globe and strong partners constitute the basis for sustainable positive development. With the ramp-up of affordable e-mobility, our autonomous vehicle fleet and the battery cell production in Germany, Volkswagen is showcasing European innovation for the world – as the global automotive tech driver.”
Oliver BlumeCEO Volkswagen Group

“In a challenging competitive environment, we achieved a decent overall financial performance in 2024. Our outlook reflects the global economic challenges and the profound changes that are happening in the industry. We keep combustion engines technologically competitive, we are simultaneously investing in electric models and software, and we continue to strengthen our regional presence – with a clear growth and investment strategy in the US. To achieve this, it is crucial that we continue to offer our customers highly attractive vehicles, while consistently reducing costs and increasing profitability. This will be our focus in the coming months and years.”
Arno AntlitzCFO & COO Volkswagen Group
Key Figures
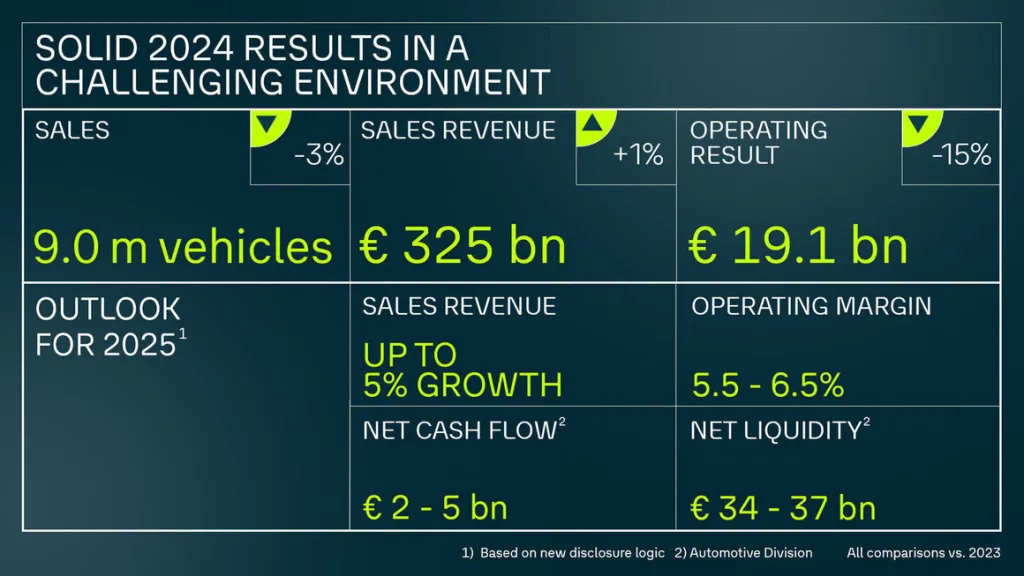
324.7 billion EUR sales revenue in FY 2024, slightly up from FY 2023 (EUR 322.3 billion)
Group sales revenue slightly up year-on-year due to positive development in the Financial Services business. At EUR 265.9 billion, sales revenue in the automotive business was slightly below previous year, mainly due to a decrease in volumes.
19.1 billion EUR Operating Result in FY 2024, 15% below FY 2023 (EUR 22.5 billion); Operating Margin of 5.9%
Decrease in Operating Result driven by a significant increase in fixed costs that include extraordinary expenses totaling EUR 2.6 billion on a net basis, particularly for restructuring.
21.7 billion EUR underlying Operating Result in FY 2024
Adjusted for non-operating items such as restructuring expenses and release of provisions, as well as before valuation effects, the 2024 Operating Margin is 6.7%.
5.0 billion EUR Net Cash Flow in the Automotive Division in FY 2024 (EUR 10.7 billion)
Automotive Net Cash Flow as expected below previous year mainly due to continued high investments and the decline in operating profit; solid Net Cash Flow of EUR 1.7 billion in Q4 2024 supported by reduction of working capital.
9.0 million vehicle sales in FY 2024, 3.5% below FY 2023 (9.4 million vehicles)
Growth in South America could not fully offset the decline in China; vehicle sales in North America and Europe at prior-year level.
+88 percent Order intake for all-electric vehicles in Western Europe increased by 88% in FY 2024
Order intake in Western Europe with significant tailwinds from extended and rejuvenated product portfolio: BEV almost doubled (+88%), overall growth +15%.
Dividend
The Board of Management and Supervisory Board are proposing a dividend of EUR 6.30 per ordinary share and EUR 6.36 per preferred share to the Annual General Meeting, representing a decrease of 30 percent compared to the previous year’s figures. The payout ratio corresponds to around 30 percent.
Outlook for 2025
The Volkswagen Group expects the sales revenue to exceed the previous year’s figure by up to 5 percent. The operating return on sales for the Group is expected to be between 5.5 and 6.5 percent.
In the Automotive Division, the Group expects an investment ratio between 12 and 13 percent in 2025. The automotive net cash flow for 2025 is expected to be between EUR 2 and EUR 5 billion. This includes cash outflows for investments for the future as well as for restructuring measures from 2024. Net liquidity in the Automotive Division in 2025 is expected to be between EUR 34 and EUR 37 billion. It remains the group’s goal to continue its robust financing and liquidity policy.
Challenges will arise in particular from an environment characterized by political uncertainty, increasing trade restrictions and geopolitical tensions, the increasing intensity of competition, volatile commodity, energy and foreign exchange markets, and more stringent emissions-related requirements.
Note: Adjustments to the reporting logic from January 2025 will lead, among other things, to a more precise disclosure of the Automotive Division’s sales revenue. In mathematical terms, this will lead to a lower investment ratio, namely by 130 basis points to 13.0 percent in the 2024 financial year.
Based on the adjusted reporting logic, we expect the investment ratio in the Automotive Division to reduce to between 12 and 13 percent in 2025 and to around 10 percent in 2027. For details, see page 180 of the 2024 Annual Report.
Further information on the brand groups
Core
Increase in sales revenue compared to previous year; Operating Margin decreased slightly to 5.0%, partly due to higher fixed costs and restructuring expenses.
Progressive
Operating Result declines significantly to EUR 3.9 billion, mainly due to restructuring expenses related to the site in Brussels and residual value effects as well as intense competition and the current model offensive. Operating Margin of 6.0%.
Sport Luxury
Slight decline in sales revenue, strong net cash flow; Operating Result decreases to EUR 5.3 billion due to numerous model launches, lower sales volumes and higher costs for materials, development services and digitalization. Operating Margin remains solid at 14.5%.
TRATON Group
Slight increase in sales revenue to EUR 46.2 billion thanks to a positive market and product mix and better unit price realization; vehicle sales on prior year level; underlying Operating Margin of 9.1%.
CARIAD
Strong increase in sales revenue to EUR 1.3 billion due to higher licensing revenue from increased vehicle volumes with CARIAD software; Operating losses with EUR 2.4 billion at prior year level; re-scaling of operations is planned.
Group Mobility
Slight increase in contract volumes; Operating Result of EUR 3.1 billion as expected well below prior year level; decline due to higher risk costs and normalization of used car prices.
Key Figures Volkswagen Group
| Q4 | FY | ||||||
| 2024 | 2023 | % | 2024 | 20231 | % | ||
| Volume Data2 in thousands | |||||||
| Deliveries to customers (units) | 2,503 | 2,524 | -0.0 | 9,027 | 9,240 | – 2.3 | |
| Vehicle sales (units) | 2,574 | 2,600 | -0.0 | 9,037 | 9,362 | – 3.5 | |
| Production (units) | 2,322 | 2,445 | -0.1 | 8,954 | 9,309 | – 3.8 | |
| Employees (on Dec. 31) | 679.5 | 684.0 | – 0.7 | ||||
| Financial Data (IFRS), € million | |||||||
| Sales revenue | 87,377 | 87,182 | +0.2 | 324,656 | 322,284 | + 0.7 | |
| Operating result | 6,153 | 6,288 | -2.1 | 19,060 | 22,528 | – 15.4 | |
| Operating return on sales (%) | 7.0 | 7.2 | 5.9 | 7.0 | |||
| Earnings before tax | 4,282 | 5,399 | -20.7 | 16,806 | 23,099 | – 27.2 | |
| Return on sales before tax (%) | 4.9 | 6.2 | 5.2 | 7.2 | |||
| Earnings after tax | 3,477 | 4,994 | -30.4 | 12,394 | 17,861 | – 30.6 | |
| Automotive Division3 | |||||||
| Cash flows from operating activities | 12,541 | 16,118 | -22.2 | 32,983 | 37,851 | – 12.9 | |
| Cash flows from investing activities attributable to operating activities4 | 10,806 | 10,358 | +4,3 | 27,971 | 27,153 | + 3.0 | |
| Net cash flow | 1,736 | 5,760 | -69.9 | 5,013 | 10,698 | – 53.1 | |
| Net liquidity at Dec. 31 | 36,066 | 40,289 | – 10.5 | ||||
| Investment ratio | 14.3 | 13.5 | |||||
1) Prior year has been adjusted (see explanations to IAS 8).
2) The figures also include the equity-accounted Chinese joint ventures. Prior-year deliveries have been updated to reflect subsequent statistical trends.
3) Including allocation of consolidation adjustments between the Automotive and Financial Services divisions.
4) Excluding acquisition and disposal of equity investments: Q4 EUR 9,580 (8,753) million, January to December EUR 26,289 (25,038) million.
Key figures by brand group and business field from January 1 to December 31
| Vehicle sales | Sales revenue | Operating result | Operating margin | |||||
| Thousand vehicles/€ million | 2024 | 2023 | 2024 | 2023 | 2024 | 20231 | 2024 | 2023 |
| Core brand group | 4,960 | 4,826 | 140,004 | 137,770 | 6,961 | 7,242 | 5.0 | 5.3 |
| Progressive brand group | 1,123 | 1,282 | 64,532 | 69,865 | 3,903 | 6,280 | 6.0 | 9.0 |
| Sport Luxury brand group2 | 313 | 334 | 36,438 | 37,349 | 5,286 | 6,938 | 14.5 | 18.6 |
| CARIAD | – | – | 1,327 | 1,078 | -2,431 | -2,392 | – | – |
| Battery | – | – | 8 | 31 | -1,053 | -417 | – | – |
| TRATON Commercial Vehicles | 335 | 339 | 46,183 | 45,731 | 4,204 | 3,715 | 9.1 | 8.1 |
| MAN Energy Solutions | – | – | 4,333 | 4,044 | 337 | 369 | 7.8 | 9.1 |
| Equity-accounted companies in China3 | 2,742 | 3,065 | – | – | – | – | – | – |
| Volkswagen Group Mobility | – | – | 54,806 | 50,765 | 3,000 | 3,248 | 5.5 | 6.4 |
| Other4 | -435 | -484 | -22,976 | -24,350 | -1,147 | -2,456 | – | |
| Volkswagen Group | 9,037 | 9,362 | 324,656 | 322,284 | 19,060 | 22,528 | 5.9 | 7.0 |
1) Prior year has been adjusted.
2) Including Porsche Financial Services: sales revenue EUR 40,083 (40,530) million, operating result EUR 5,640 (7,284) million.
3) The sales revenue and operating result of the equity-accounted companies in China are not included in the consolidated figures; the share of the operating result generated by these companies amounted to EUR 1,742 (2,621) million.
4) In the operating result, mainly intragroup items recognized in profit or loss, in particular from the elimination of intercompany profits; the figure includes depreciation and amortization of identifiable assets as part of purchase price allocation, as well as companies not allocated to the brands.